I appear to have opened a bit of a can of worms with my Performance Manager (PM) graph. So, for those of you (Guy in particular) who want some more info, here’s an explanation of each of the graph elements and what they signify.
The PM attempts to provide you with an indication of Form by looking at the cumulative effects of your training stress (TSS). Form (according to Andy Coggan) can be regarded as Fitness + Freshness. You need both to perform at your best. Here’s how the elements of the PM help define your Form:
ATL – Acute Training Load represents your current degree of freshness, being an exponentially weighted average of your training over a period of 5-10 days. This period is referred to as a time constant (TC). The formula for ATL looks like this:

Where 


CTL – Chronic Training Load represents your current degree of fitness as an exponentially weighted average of you training over a 42 day period. Building your CTL is a bit like putting money in your savings account. If you don’t put much in you won’t be able to draw much out at a later date. The formula for CTL looks like this:
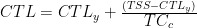
Where 

TSB – Training Stress Balance. This is simply the difference between your CTL and ATL, and represents your form.

A negative TSB is indicative of a high training load, i.e. high ATL relative to CTL, such as would occur in a high load training week. Alternatively, a period of taper leading up to an event should correspond with an increasing TSB where ATL is reduced relative to the current CTL.
Where TSB is positive, there is a strong indication of good performance following a consistent period of training. To help me define instances of good performance, the black line on the graph shows my ten best 20 minute mean maximal power efforts. My best three correspond to a decreased ATL following a rest week, where TSB is recovering from -20 to +5. For the time being, as I’m still in a base/build phase, I’m looking to steadily increase my CTL in preparation for TransScotland and especially Mountain Mayhem.
More (and better) articles on this subject are available from the Cyclingpeaks website. The formulas for ATL and CTL are adapted from the LW Coaching website.
Edit (15/03/07): I’ve discovered to my suprise (and horror) that a search in Google for the the above terms brings you here before places like the Cyclingpeaks website. This short article doesn’t attempt to take anything away from the guys that designed all these clever fitness metrics, so if you’ve come to this page without having visiting Cyclingpeaks then click here. The text above gives my (abridged) interpretation to the system, and there’s no substitute for hearing it from the horses mouth 😉

I’m using the Training Load plugin with SportTracks to look at CTL/ATL and TRIMP and trying to make sense of the graphs, so I hit upon this page. Thanks for the explanation ! I think my confusion was whether high was “good” or “bad”. In SportTracks ATL is labeled “fatigue” which I think makes more sense than freshness, TSB is labeled “Performance” (a bit generic, but…)
Thanks Eric. I have no experience with SportTracks, so your comments will be of use to others who are, I’m sure.
Nice simple explanation of these key training metrics and how to calculate them… thank you!!